Synthetic monitoring that lands in your stackas standard OTLP.
HTTP and Playwright browser monitors — anomaly-scored, dependency-attributed, trace-linked — streamed as standard OTLP into ClickStack, Grafana, or any backend you already run.
npx @yorker/cli init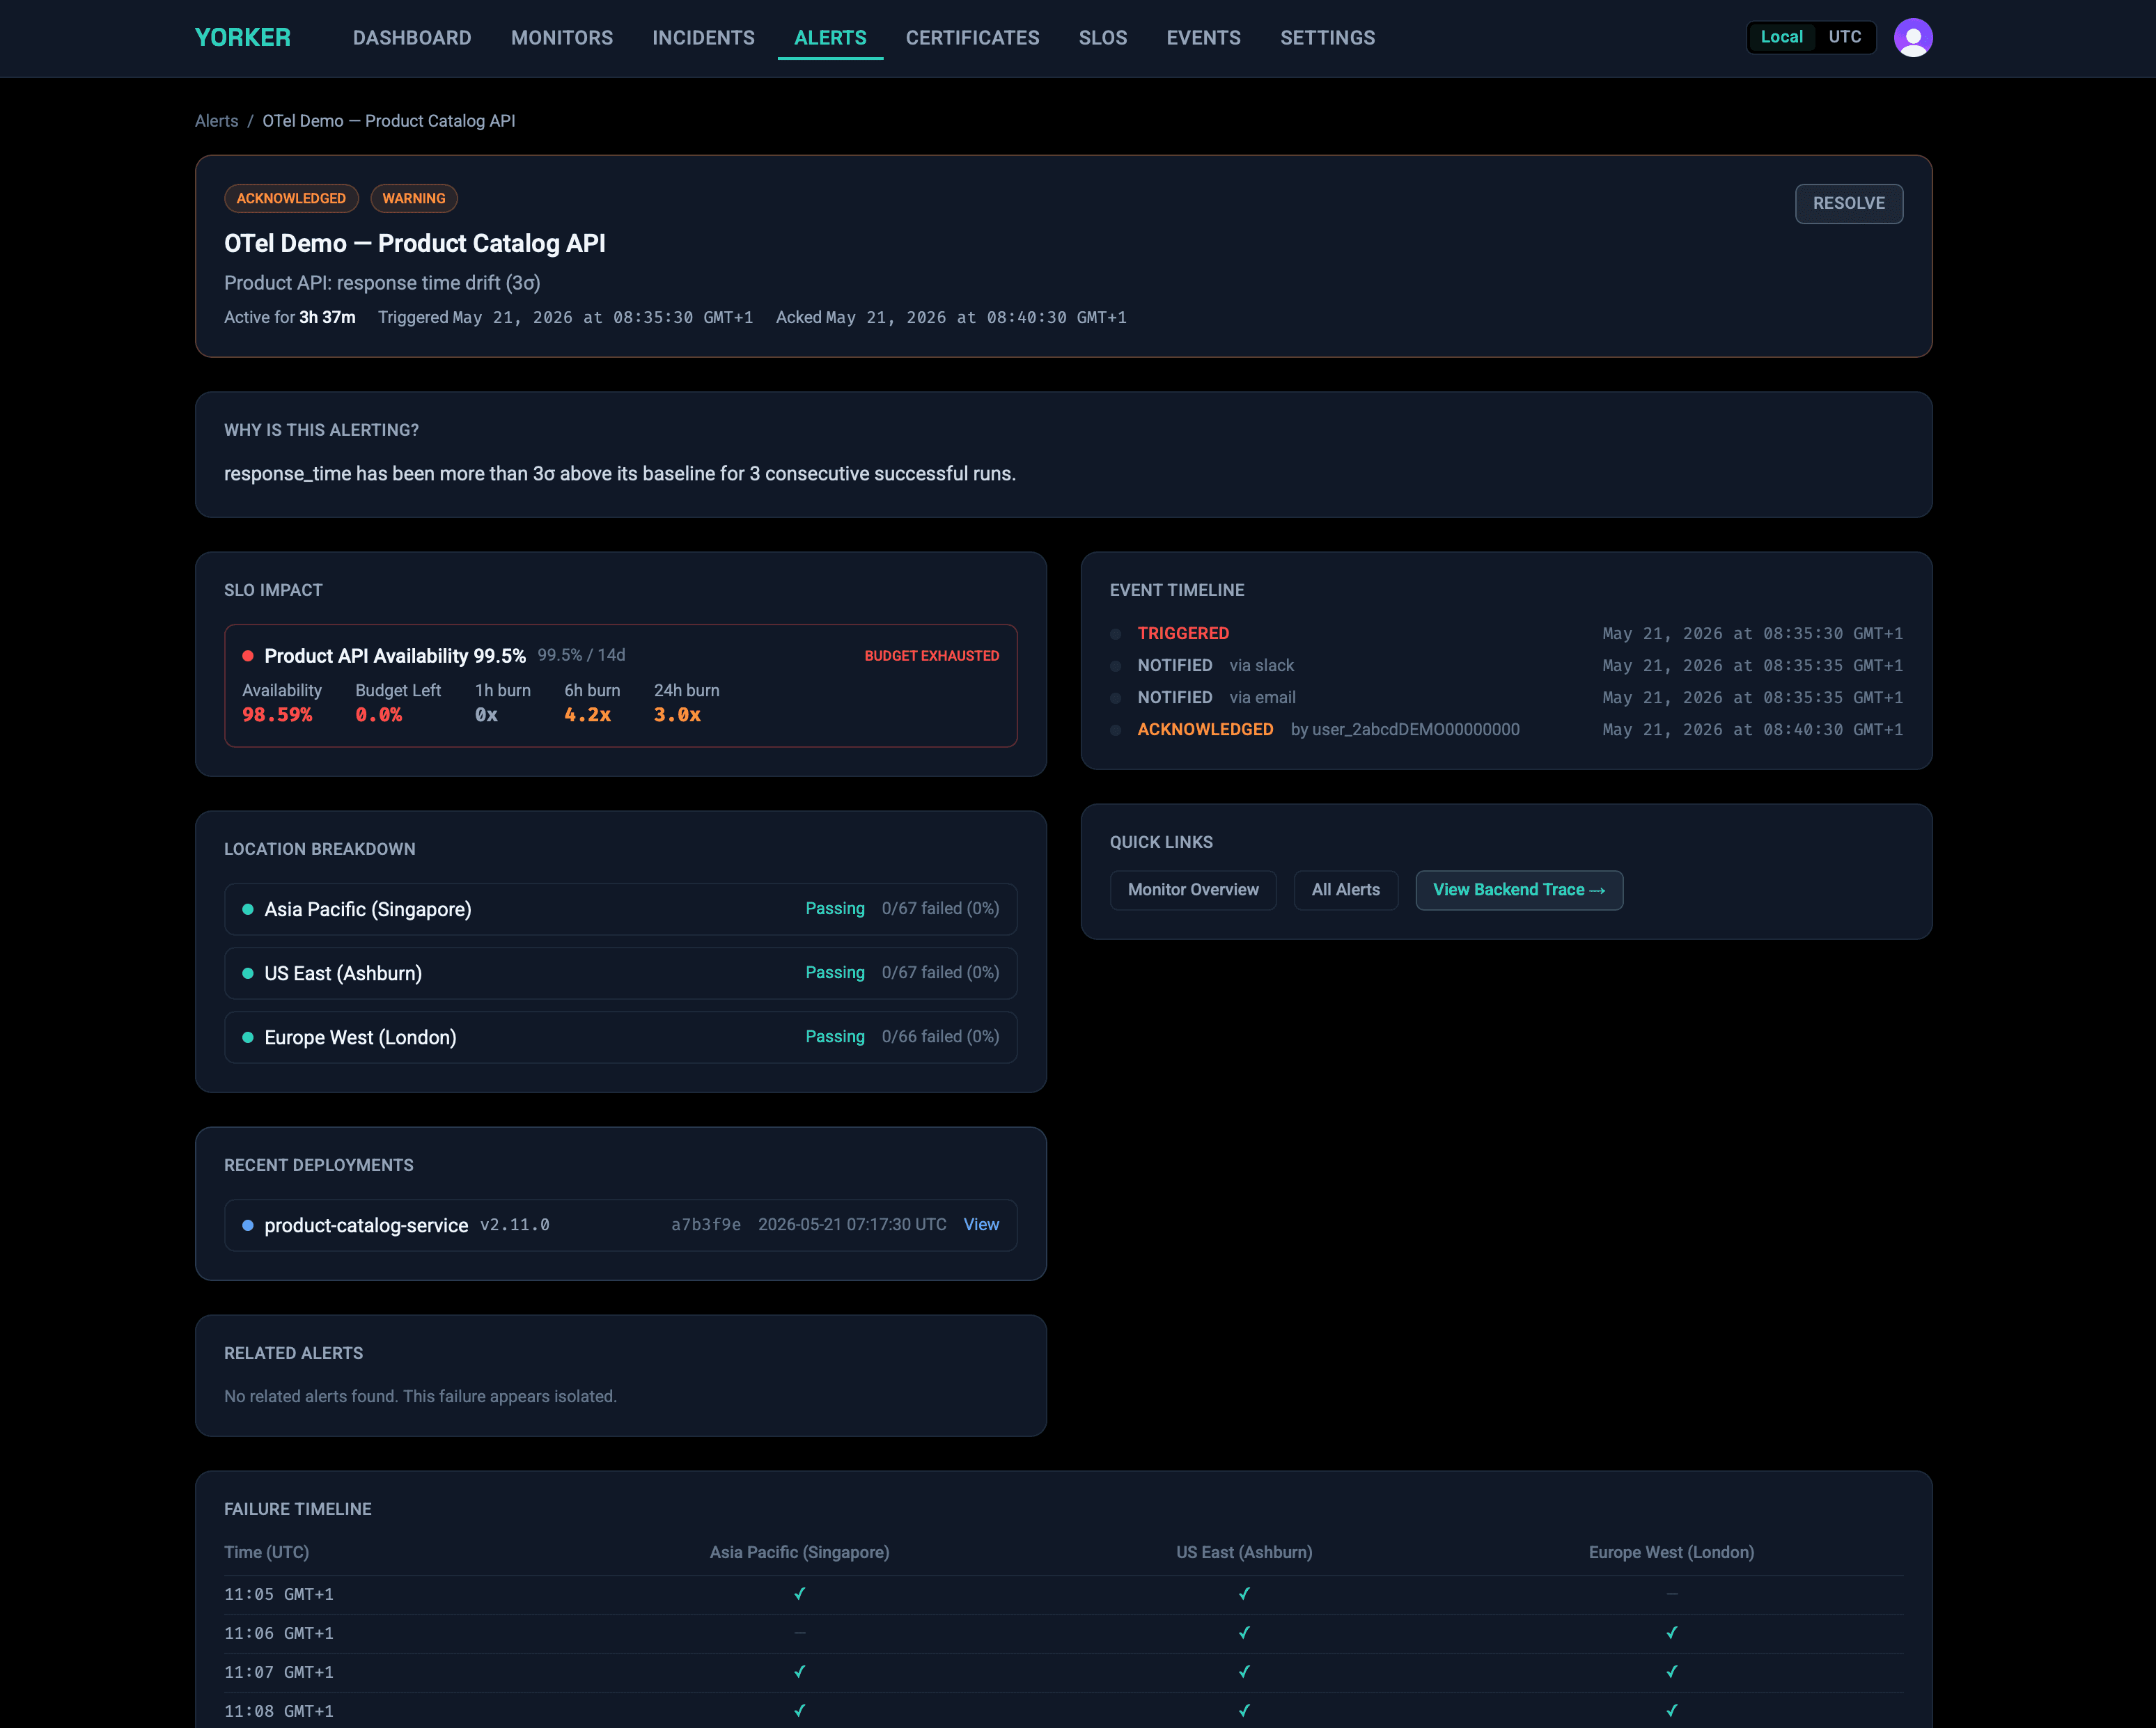
Why teams choose Yorker
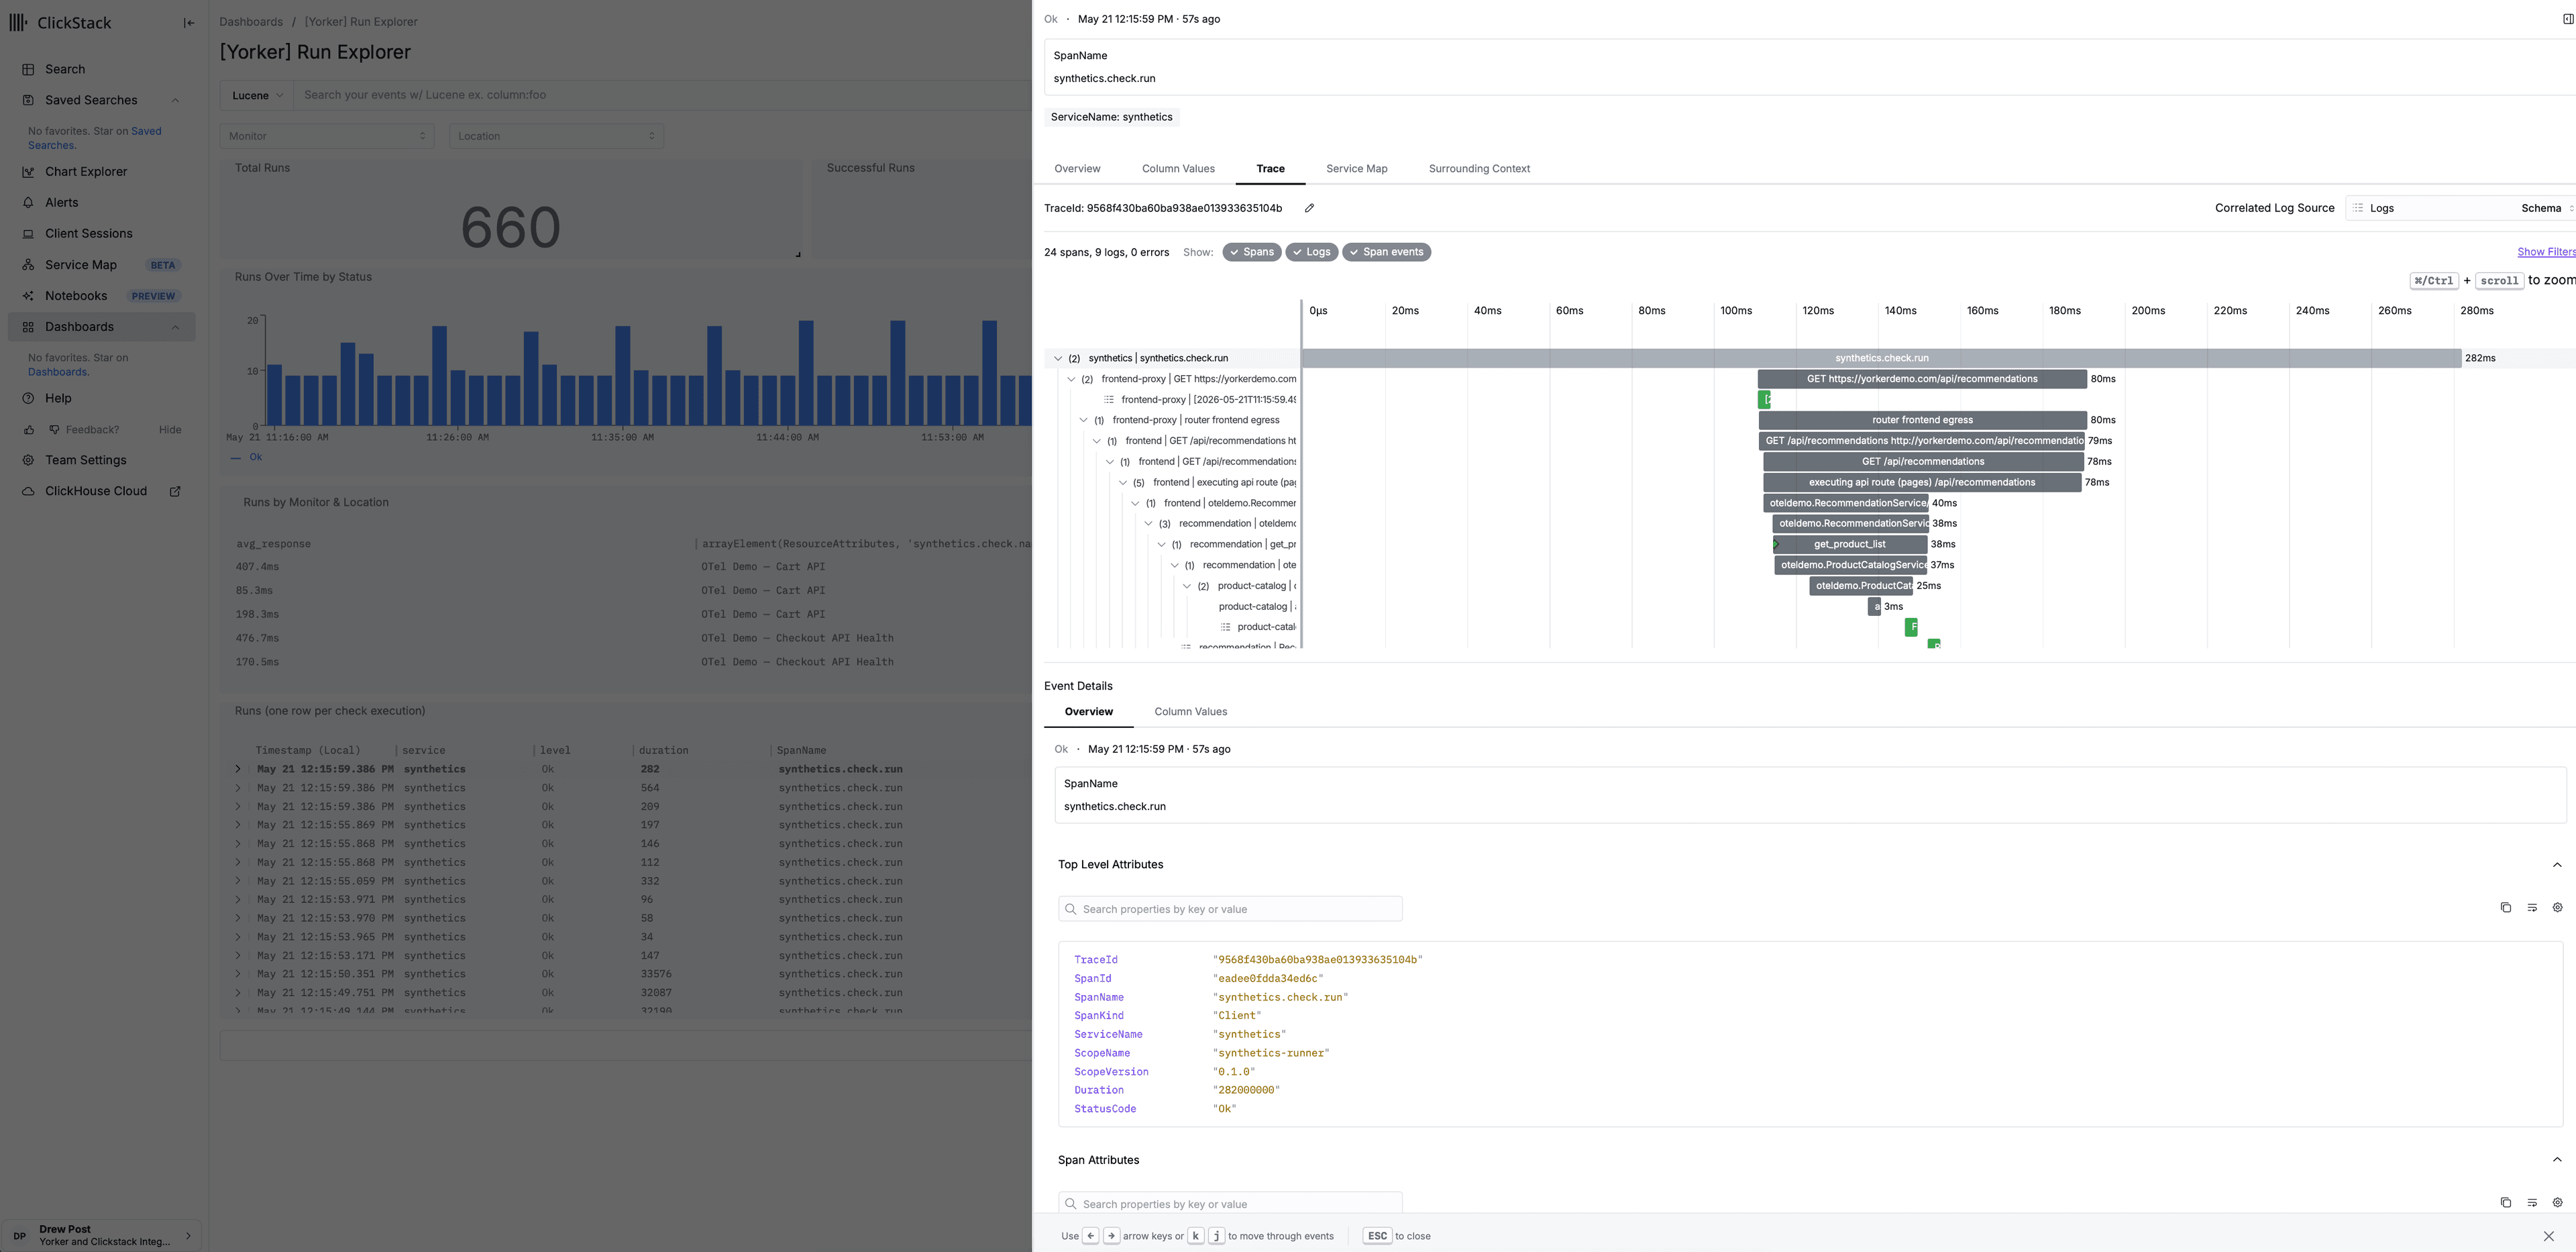
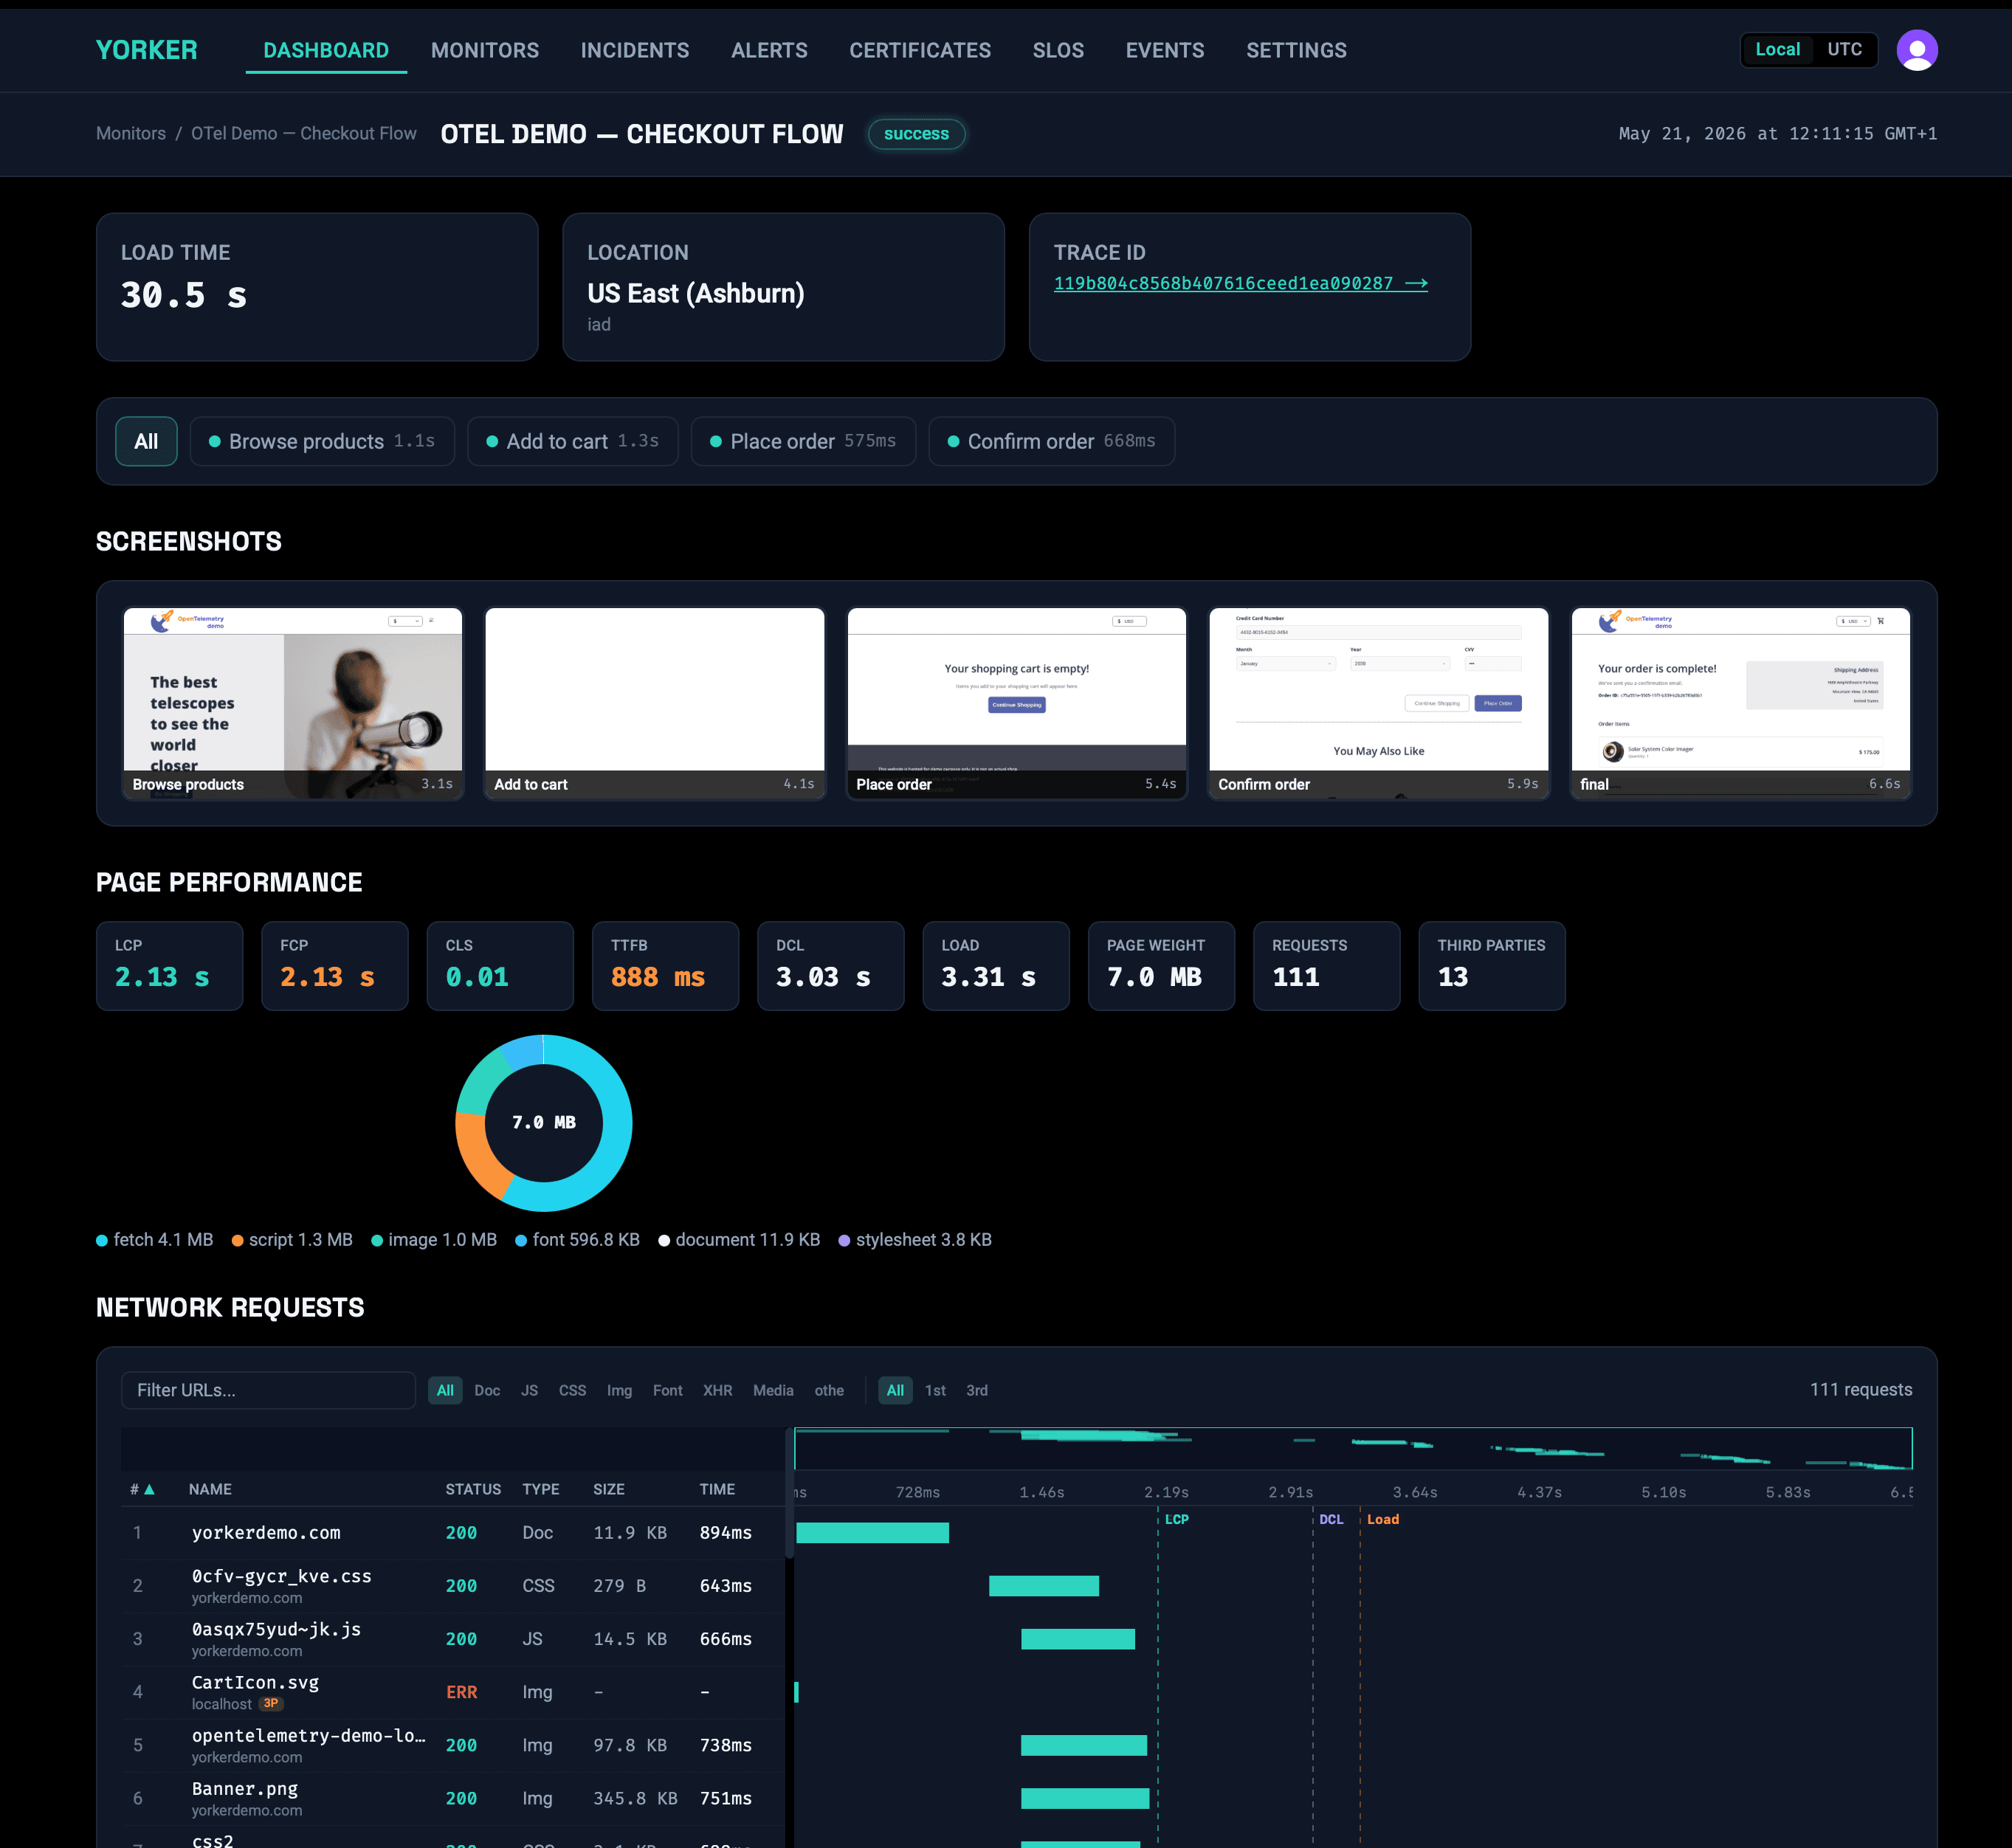
Click from a failed check to the trace that explains it
Every check injects a W3C traceparent, so the synthetic run and your backend request are one distributed trace. When checkout slows, jump from the alert straight to the backend span — the slow query, the exact timing — inside your own ClickStack or Grafana. No more “it’s slow” with nowhere to look.
Anomaly detection, not thresholds you babysit
Stop hand-tuning a threshold for every check in every region. Yorker scores each metric against a per-location, per-hour baseline and alerts on deviation in σ — catching a slow 200 ms creep a static limit would miss, without the 3 a.m. false alarms.
Your backend and your repo — never a walled garden
Checks emit standard OTLP into the backend you already run, and monitors live as yorker.config.yaml next to your code. Query synthetic data beside your app telemetry, review monitors in PRs, and walk away any time. Nothing proprietary to migrate off.
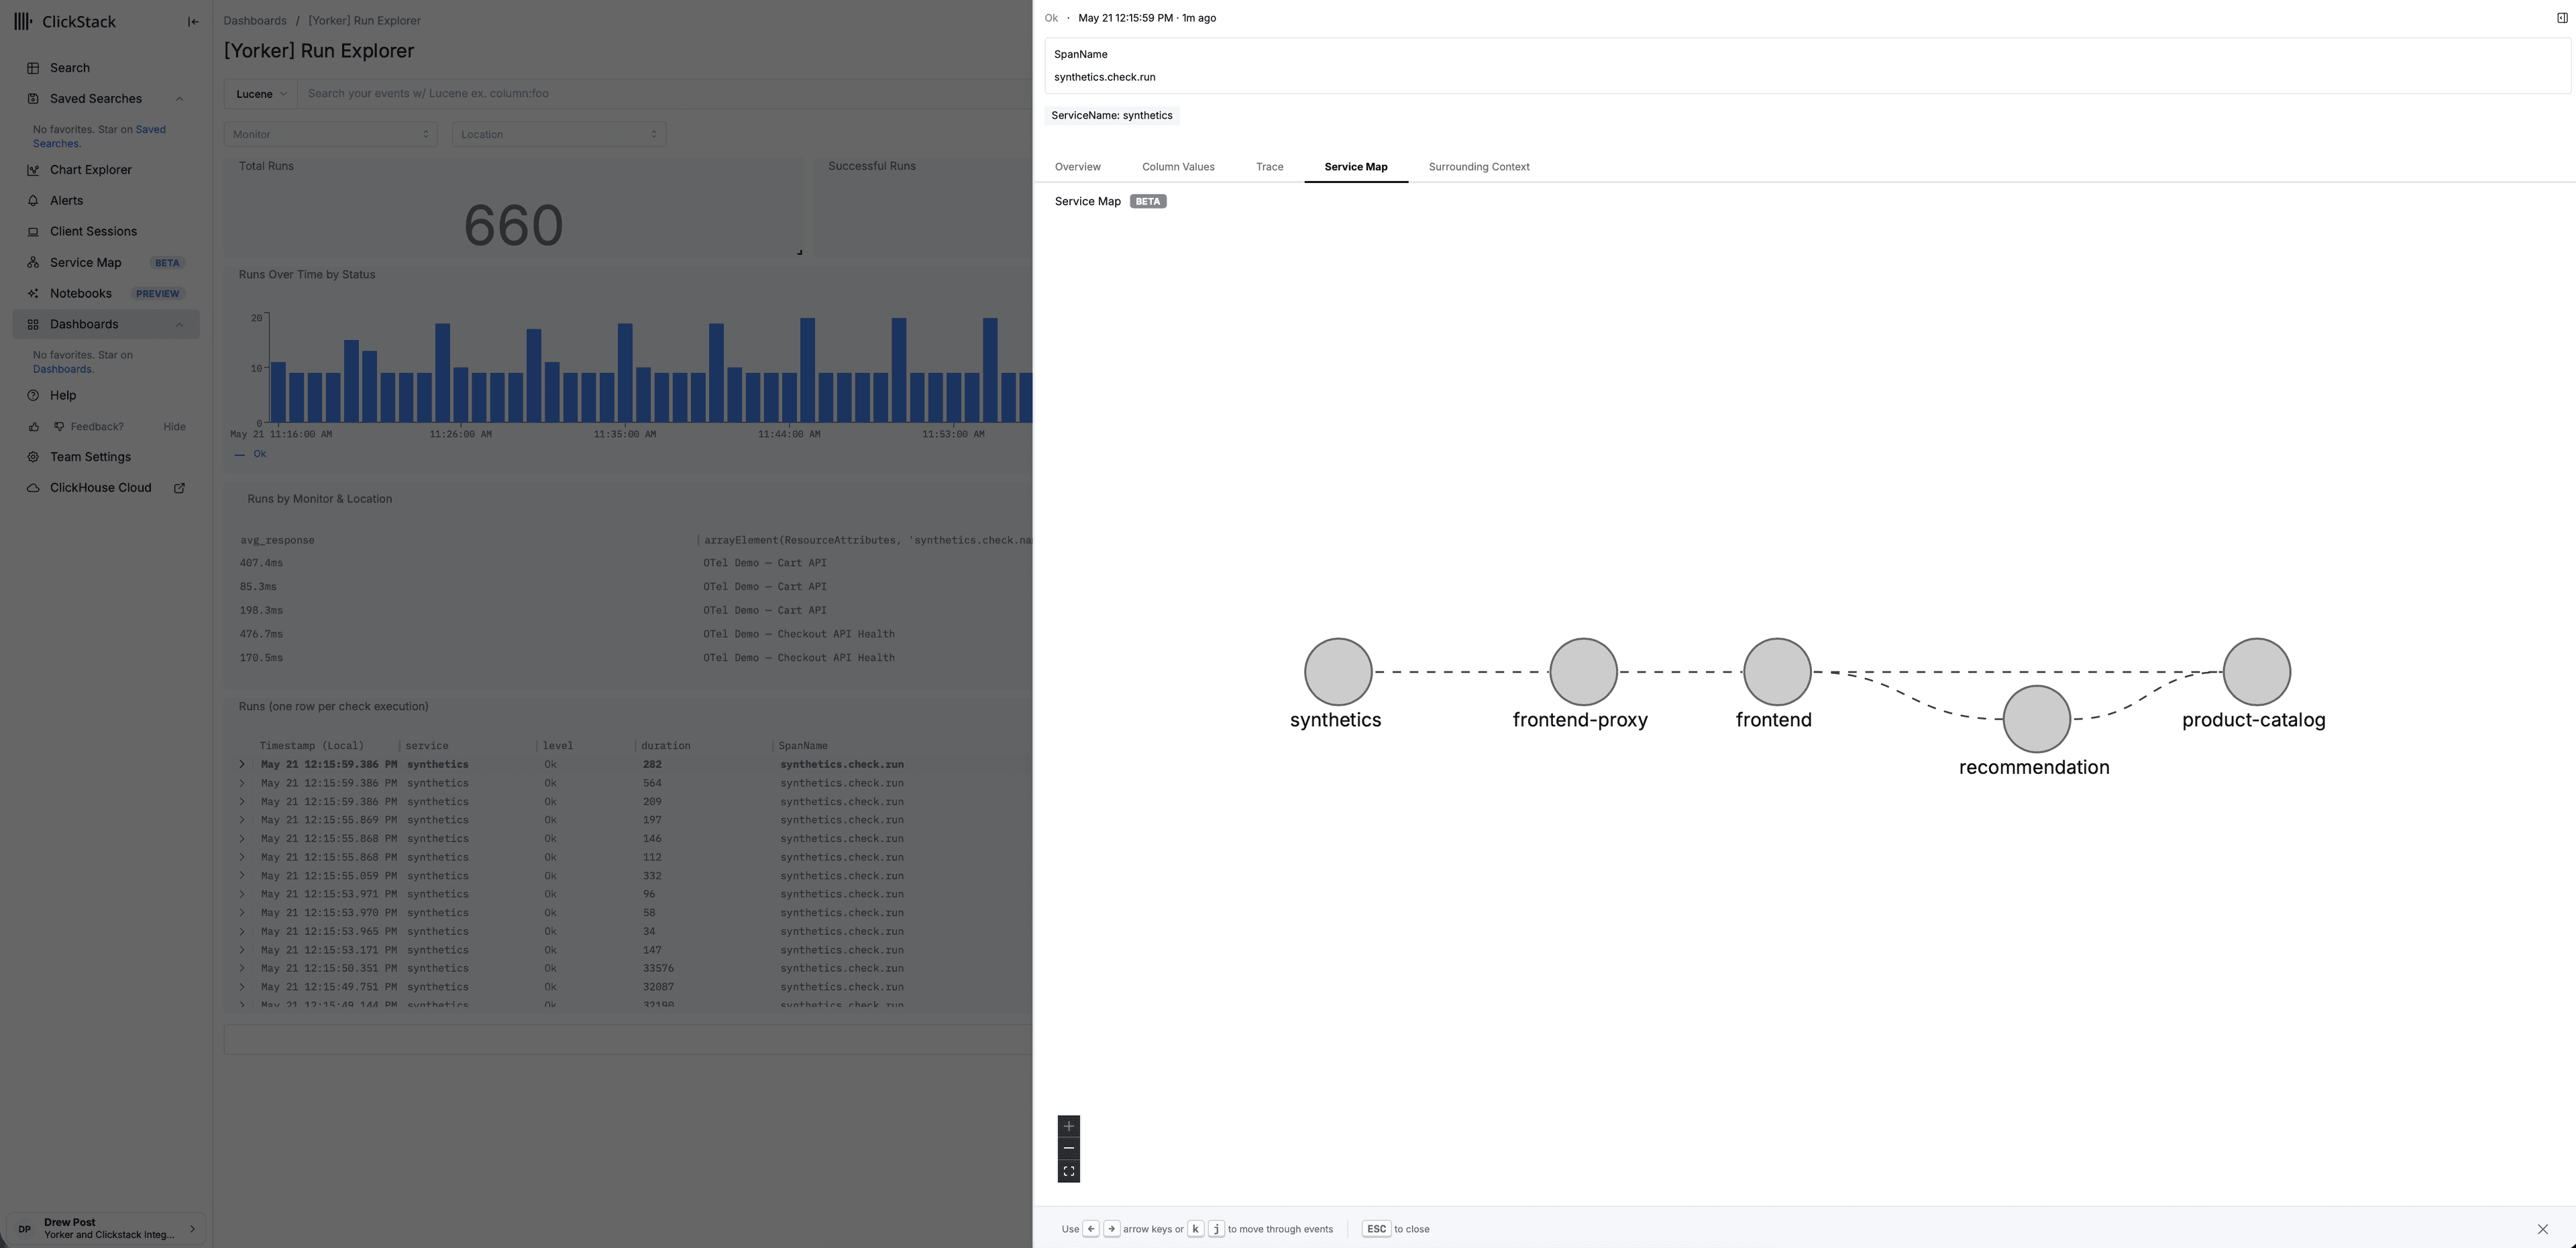
Yorker is the synthetic signalClickStack and HyperDX were waiting for.
ClickHouse's observability stack gives you fast, open SQL over your telemetry. Yorker fills the synthetic-monitoring gap with spans, metrics and log events that land natively in ClickStack/HyperDX, complete with W3C traceparent propagation so a failing checkout links straight to the backend trace that explains it.
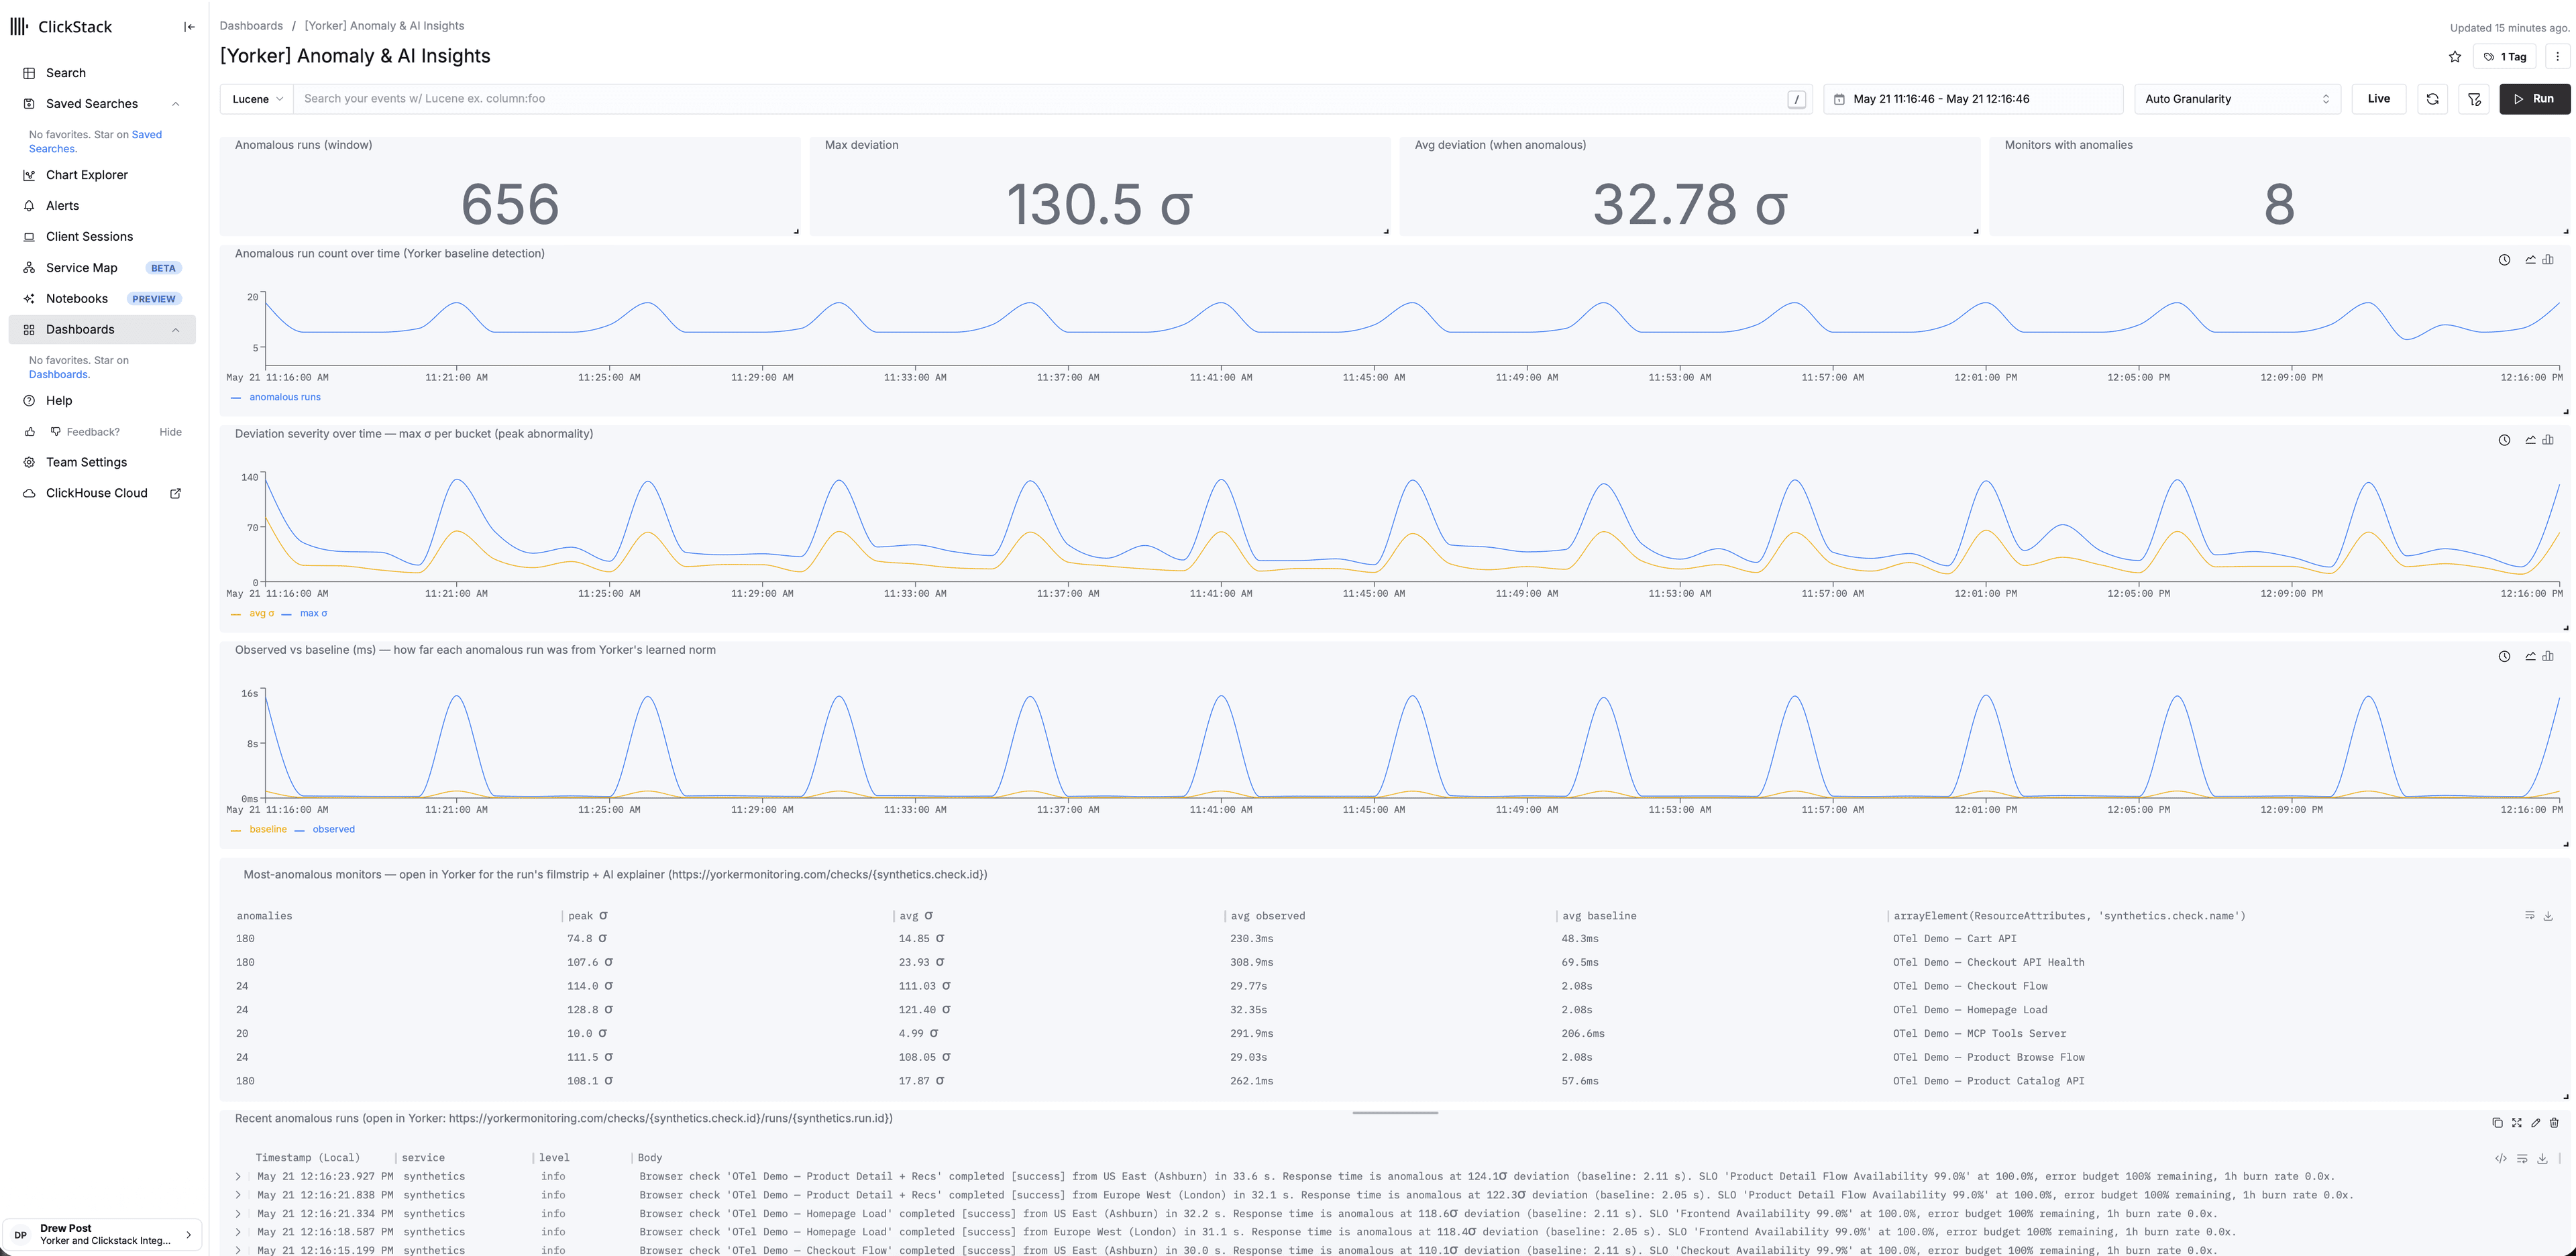
Point Yorker at your HyperDX OTLP endpoint and one-click provision the 8 pre-built dashboards into self-hosted HyperDX or ClickStack Cloud.
Why a synthetic monitoring tool built OTLP-first, for the ClickHouse/ClickStack era, looks different from the platform-era incumbents.
Same OTLP signal also flows into
Not metrics. Intelligence.
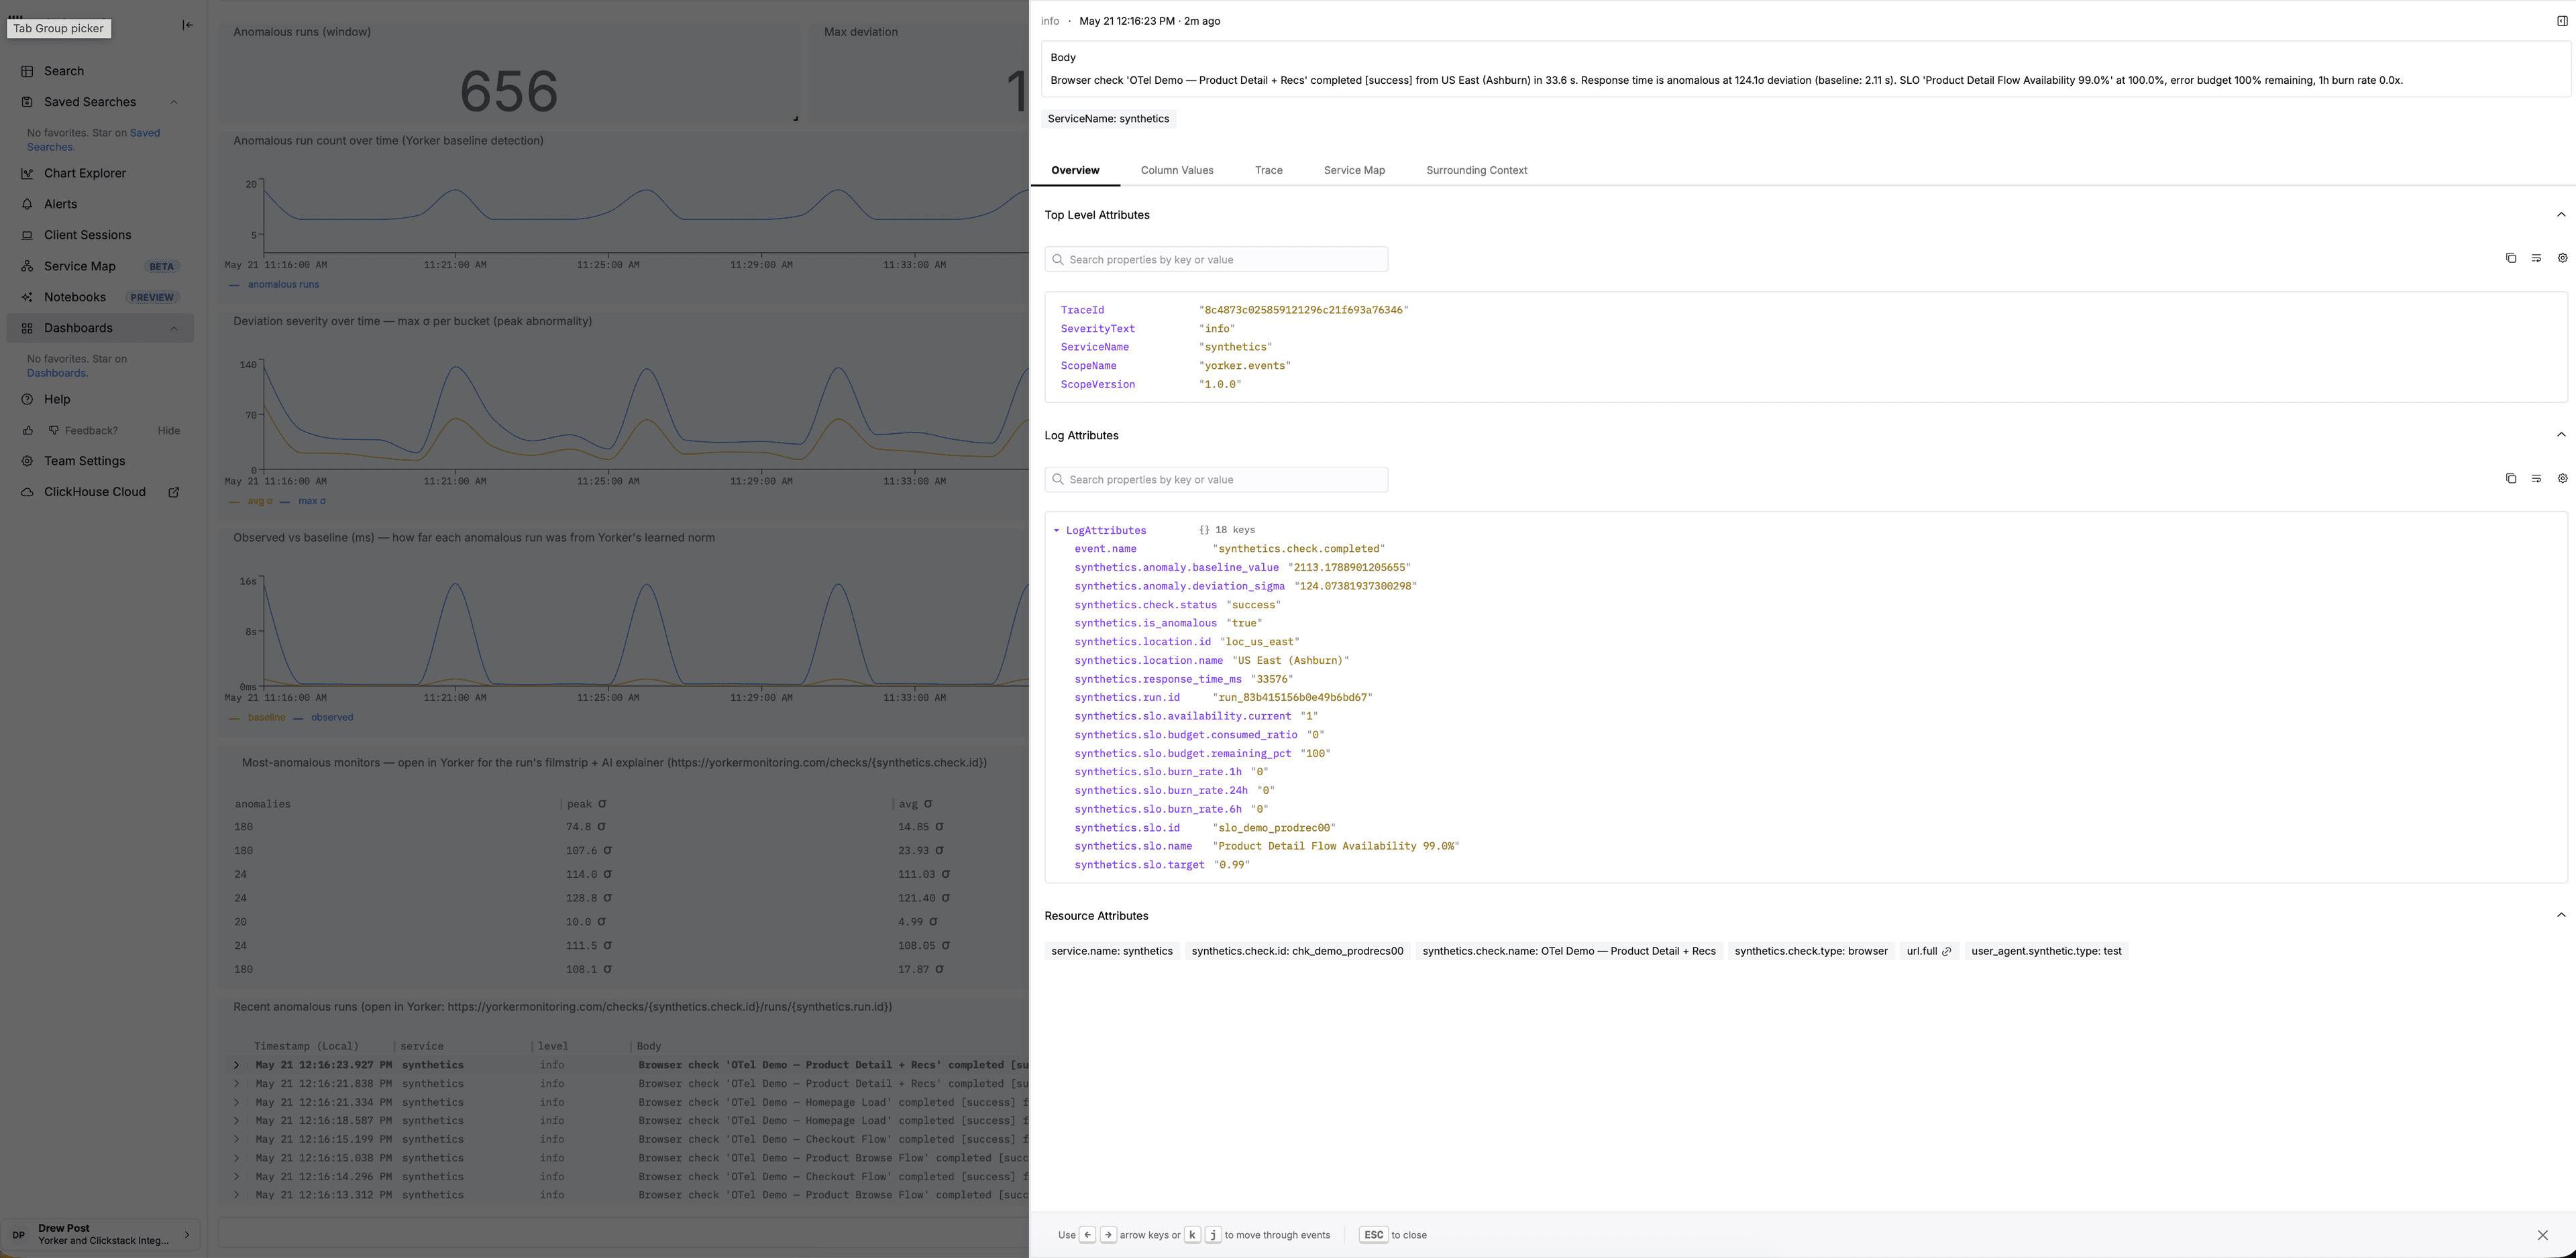
Basic synthetic monitoring gives you a response time and a pass/fail. Yorker emits a full OTLP insight pack on every run — dependency attribution, screenshot URLs, timing breakdowns, and a check.completed event with anomaly deviation attached when behavior drifts from baseline. Standard traces, metrics, and logs you can query anywhere.
Anomaly attributes on every check.completed event
Every metric is scored against a rolling baseline — per location, per hour of day. When a run drifts, the deviation in σ rides along on the check.completed event as a log attribute.
Dependency attribution
Third-party count, total bytes, and the full domain list land as span attributes on every browser check. You see cdn.tagmanager.net by name in your own table — not just a number.
Cross-monitor correlation
When several monitors fail in the same window against the same dependency, Yorker emits a correlation.detected event with the affected check IDs. Co-occurrence signal across your fleet, ready to query.
Screenshot URLs in traces
Browser-check screenshots are stored and linked right inside the OTel span. Pull the filmstrip up from Grafana, a ClickStack incident, or your runbook.
W3C trace propagation
Browser checks inject traceparent into every request, and your backend picks it up. The synthetic check and the real request share one distributed trace.
TLS context in every check
Certificate expiry, issuer chain, and fingerprint ride along as span attributes. Your dashboard knows the cert dies in 4 days — before a user hits a browser warning.
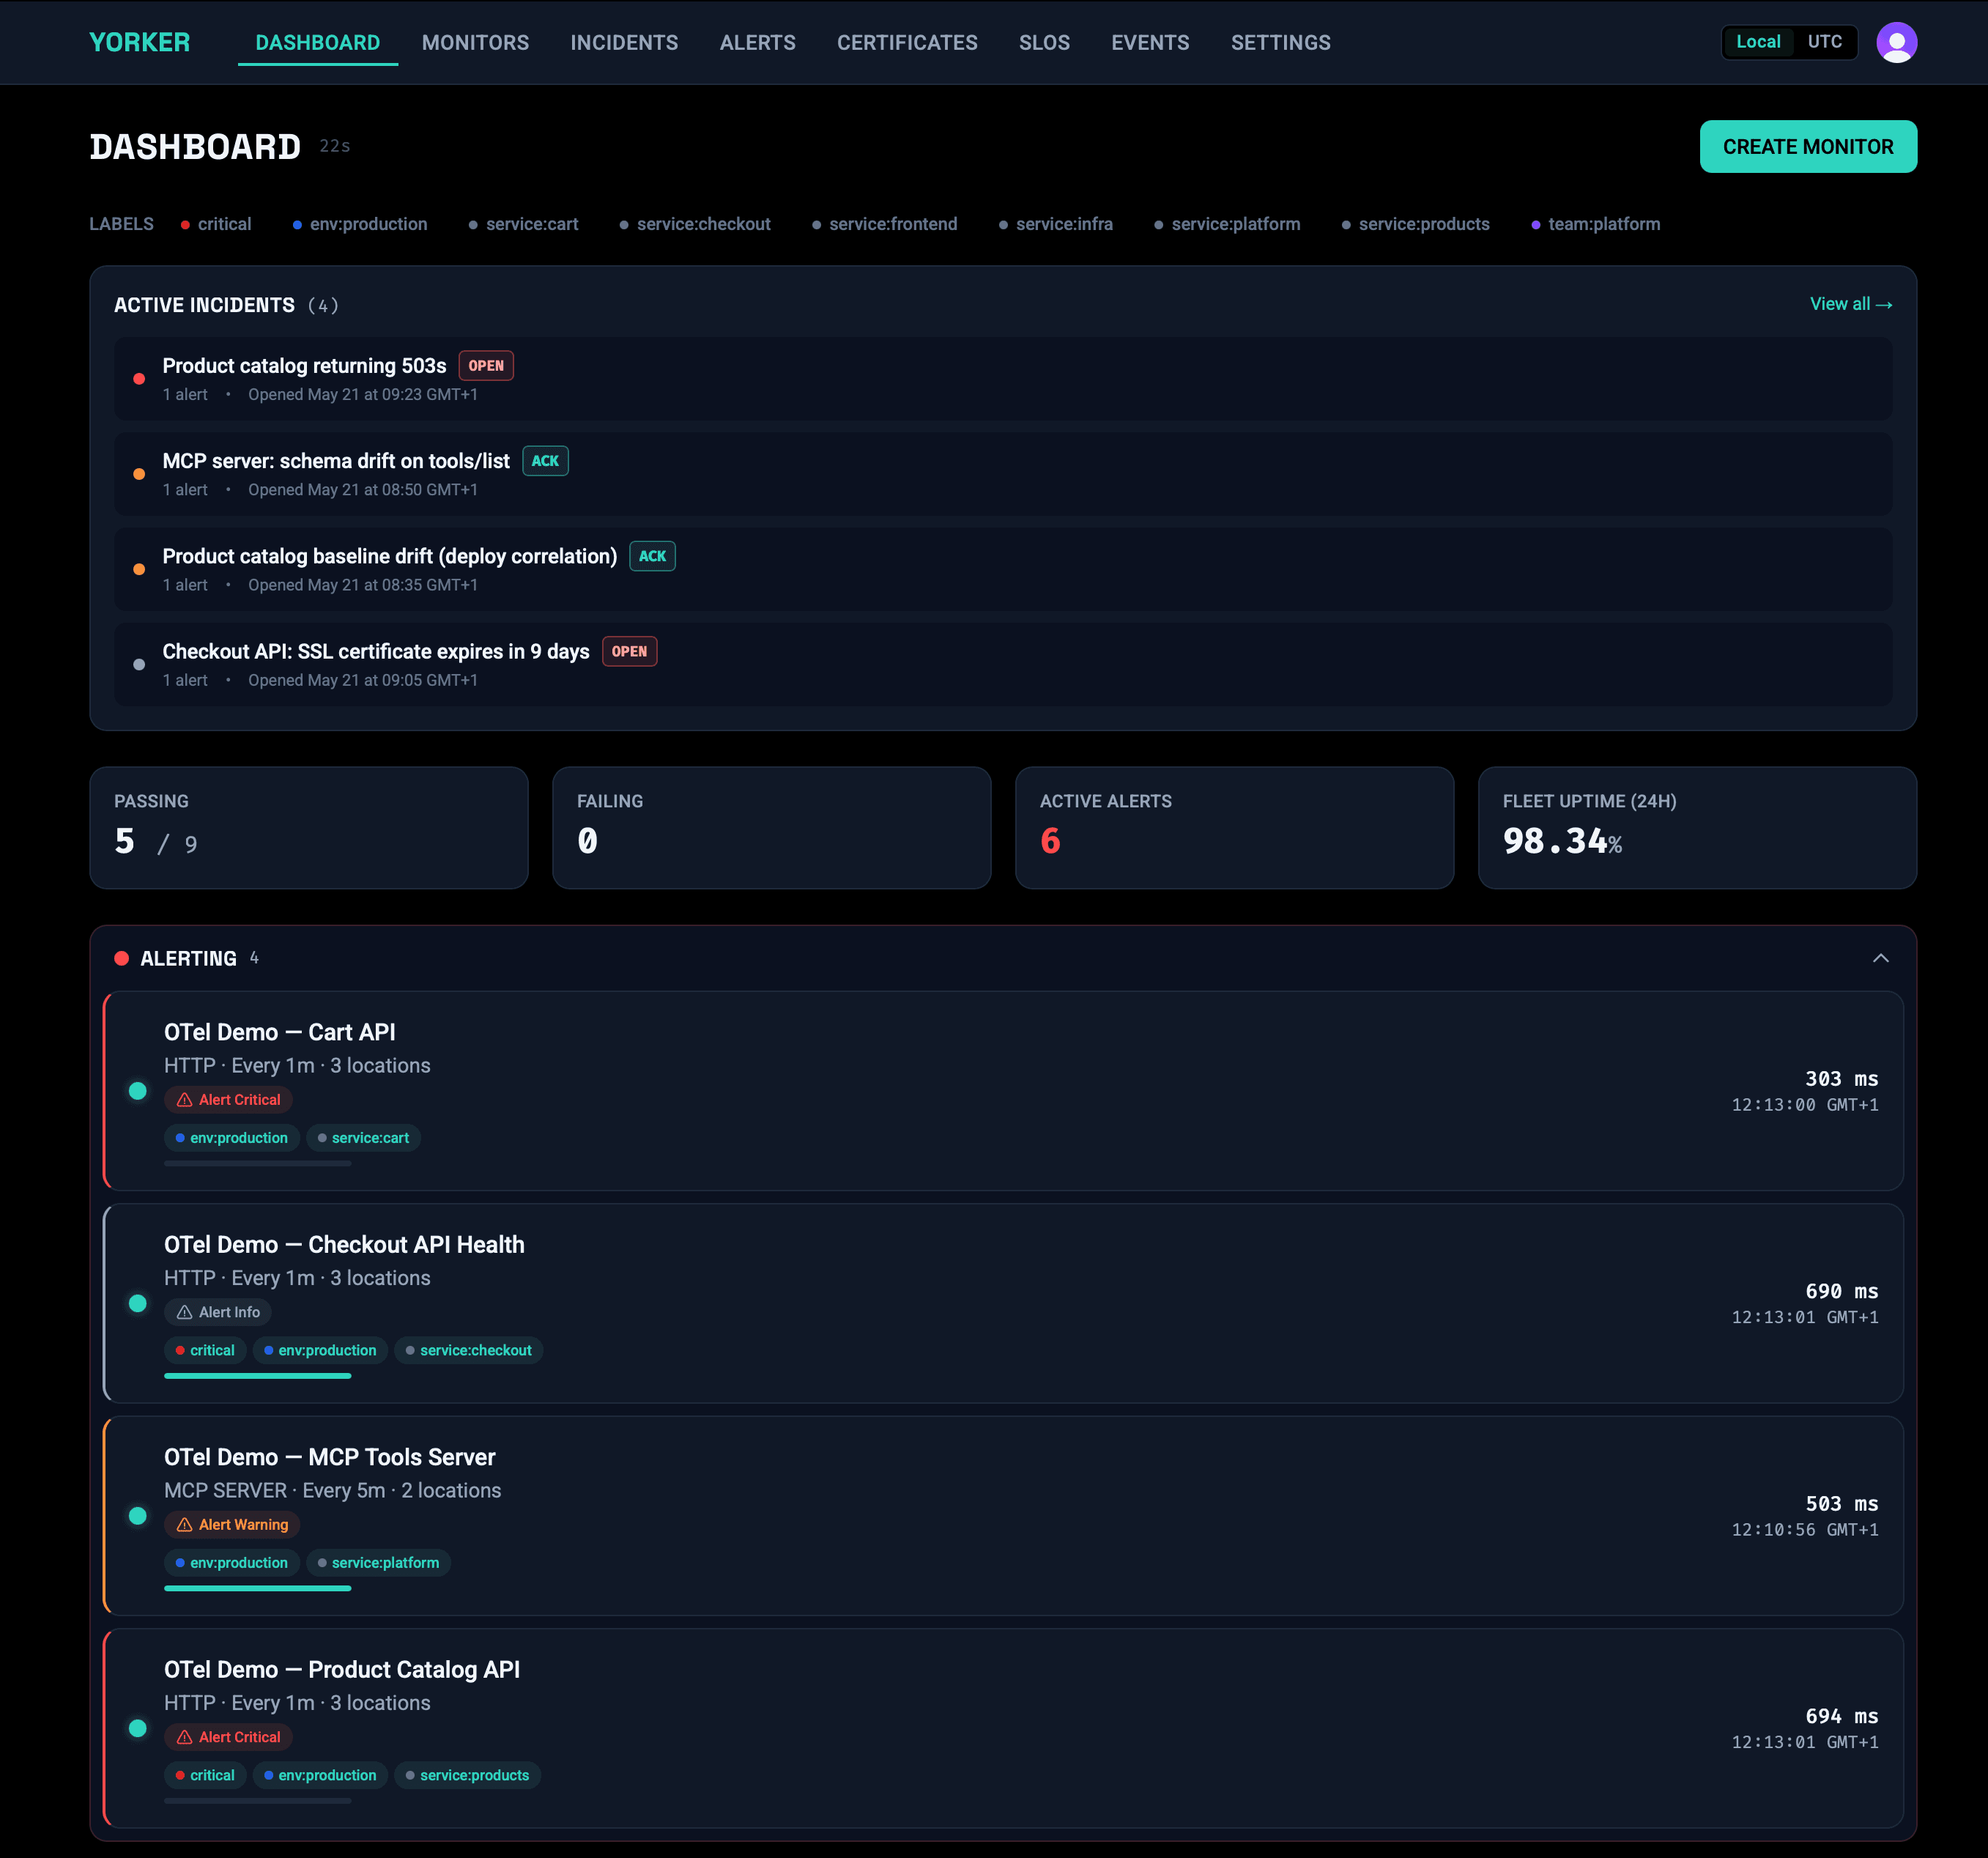
Monitors aren't silos.Shared failures are shared signals.
That ad network script loaded via tag manager, the one that never goes through your release process, just added 600ms to six different user journeys simultaneously. Yorker sees the pattern across monitors, not per-monitor in isolation.
- Request-level attribution, across monitors
Payload weight and latency tracked per third-party domain across every browser check. When cdn.adnetwork.com degrades, all six affected monitors surface it together.
- Baseline anomaly alerts on dependencies you don't deploy
Anomaly detection operates at the dependency level, not just the check level. Get alerted when a third-party script changes behavior, before your users feel it.
- Pattern detection across your monitor portfolio
When multiple browser monitors fail within a five-minute window and share a third-party dependency, Yorker surfaces the co-occurrence automatically as one log event per distinct correlation slice. Structured signal to investigate, not six separate alerts to correlate manually.
Your ops tools are only as goodas what you feed them.
Automated oncall tools, causal analysis platforms, ClickStack AI Notebooks, PagerDuty runbooks: they reason over the data you give them. Without pre-correlated, trace-linked front-end intelligence, they're working with half the picture.
Yorker gives them what they don't have: the user-facing layer, already processed and attributed, with the right OTel attributes and trace headers to cross-link with everything else in your stack.
- Deviation in σ attached as log attributes when behavior drifts
- Third-party attribution already labelled
- Cross-monitor correlation events emitted on browser-check co-failures
- Screenshot URLs embedded in spans
- W3C traceparent for backend cross-linking
- Structured logs with full assertion context
Author monitors the way you ship code.
Agentic workflows in both directions: Yorker as a data source your agents consume, and Yorker as a tool that monitors your AI infrastructure.
Monitor your AI tools
HTTP 200 doesn't mean your AI feature is working. Yorker's MCP server check validates what your Model Context Protocol servers actually return: tool availability, output correctness, and latency baselines.
- Tool availability: is the MCP server responding?
- Output validation: does the response contain expected values?
- Latency baselines: is your model taking longer than usual?
Designed to be used by agents
Full CLI with deploy, validate, test, and status commands. API-first design. YAML config that lives in your repo alongside your code. Coding assistants speak fluent Yorker: they create and manage monitors the same way they write infrastructure.
$ yorker deploy
  ✓ 2 monitors created

$ yorker status
  ✓ Checkout Flow    passing
  ✓ API Health       passing

$ yorker test checkout
✓ Test run complete · 1.2sType a description.Get a Playwright script.
Describe what you want to monitor in plain English. Yorker generates a complete yorker.config.yaml with a Playwright script attached — ready to deploy or commit to your repo. Edit the output, own the config, no lock-in.
"Monitor the checkout flow on shop.example.com — add an item to cart, go to checkout, confirm the order total appears. Run every 5 minutes from London and Singapore. Alert me if it fails or takes more than 8 seconds."
# Generated by Yorker NL — edit freely
project: shop-example

monitors:
  - name: Checkout Flow
    type: browser
    script: ./monitors/checkout-flow.ts
    frequency: 5m
    locations:
      - loc_eu_west
      - loc_ap_southeast
    assertions:
      - type: duration
        threshold_ms: 8000
    alerts:
      - channel: email
        on: [failure, threshold_exceeded]
import { test, expect } from '@playwright/test';

// Generated by Yorker NL — edit freely
test('Checkout Flow', async ({ page }) => {
  // 1. Load the shop and add a product to cart
  await page.goto('https://shop.example.com');
  await page.getByRole('button', { name: 'Add to cart' }).click();

  // 2. Navigate to checkout
  await page.getByRole('link', { name: 'Checkout' }).click();

  // 3. Confirm the order total is visible
  await expect(page.getByTestId('order-total')).toBeVisible();
});# Define monitors alongside your app code
project: my-app
monitors:
- name: API Health
type: http
url: https://api.example.com/health
frequency: 1m
assertions:
- type: status_code
value: 200
- name: Checkout Flow
type: browser
script: ./monitors/checkout.ts
frequency: 5m
locations: [loc_eu_west, loc_eu_central, loc_ap_northeast]And yes, it's all code.
Plain YAML. Terraform-style plan/apply. Git-native. CI/CD-ready. Monitors live in your repo, reviewed in your PRs, deployed in your pipeline.
- Preview changes with --dry-run before applying
- Clean up orphaned monitors with --prune
- Validate config in CI with yorker validate
- Secrets stay in env vars, never in your repo
14 Global Locations
Each check runs in an ephemeral, tenant-isolated runner — your check configs and credentials never execute in a container another customer has touched.
Private locations behind your firewall available on every paid plan.
- Ashburn
- Dallas
- Los Angeles
- Toronto
- São Paulo
- London
- Paris
- Frankfurt
- Stockholm
- Singapore
- Tokyo
- Mumbai
- Sydney
- Johannesburg
- Free tier: 10,000 HTTP + MCP runs + 1,500 browser runs/mo, 1 hosted location
- No credit card required to start
- Paid plan unlocks all 14 hosted locations, correlation analysis, and alert triage
- Private locations at half the hosted run rate (paid: up to 2, Enterprise: unlimited)
See the part of your stack your users actually touch.
Start with the dashboard or go straight to code.
Or start from the terminal
npx @yorker/cli init